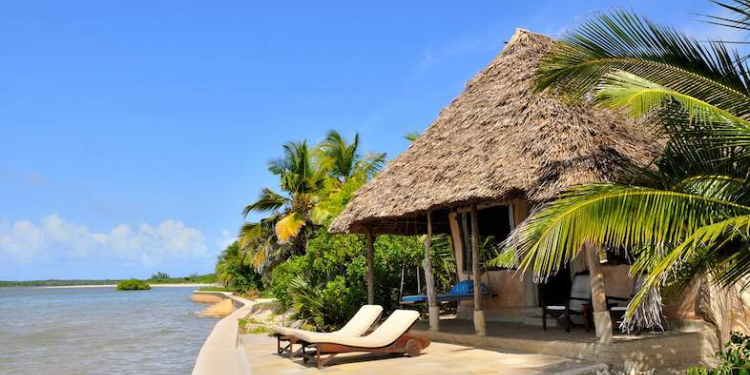


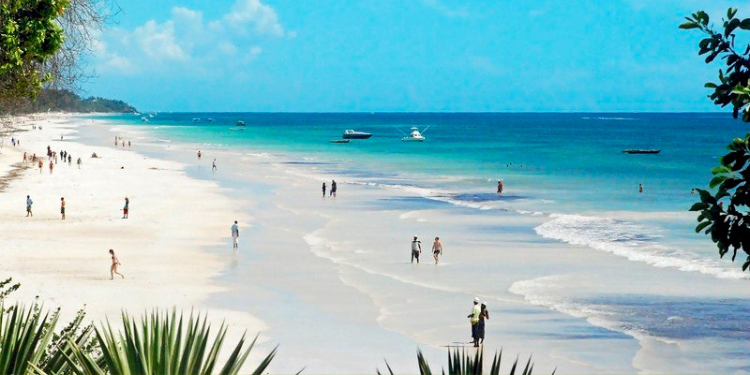
Land prices across Kenya’s coast have continued to rise, with prime beachfront towns such as Diani, Nyali, Lamu, and Watamu recording some of the strongest gains as investor appetite for coastal property remains high, according to the latest Hass Composite Land Index.
The report, which tracks quarterly, annual, and five-year land price trends, shows that tourism-driven towns and premium beachfront areas continue to command the highest values across the coast.
Why Diani, Lamu, and Watamu Land Prices Have Surged
According to the report, Coastal land price in Diani and Watamu have risen by over 70 percent since the COVID pandemic, with natural beauty the top driver of the price growth.
The new index, covering 12 coastal towns from Lamu in the north to Diani in the south, found that the fastest land price growth was recorded in areas with the widest beaches and greatest natural beauty.
For areas with narrower beaches, lower accessibility, and fewer lifestyle facilities — but still distinct natural appeal — price growth has averaged about 40 percent since the end of 2020.
These include expanding resort zones in and around Kilifi Town, Kikambala and Mombasa City.
The most subdued growth has been recorded in areas such as Vipingo and Malindi, where prices have increased by roughly 25 percent since the end of 2020.
“The beauty premium is also the leading price factor within areas, with beachfront properties in Nyali, for example, selling for 19 percent more than the area average, while properties even one row back sell at 9 percent below the average. A sea view is a priceless asset,” said Co-CEO & Creative Director at HassConsul, Sakina Hassanali.
Diani emerged as the fastest-growing market among the listed towns, posting a 79.1 percent increase over five years.
The South Coast destination now has an average land value of Ksh36 million, while beachfront land averages Ksh65.3 million per acre.
Watamu posted a 70.4 percent five-year increase, despite a slight quarterly decline. The town’s average land value stands at Ksh35 million, while beachfront land averages Ksh44.5 million per acre.
Lamu Island, including Shela Beach, remained one of the most premium coastal property markets, with average land prices standing at Ksh81.7 million and beachfront acre prices reaching Ksh139.9 million.
The island recorded a 59.7 percent increase over five years.
Also Read: Nairobi Residents Under Pressure as Rents Reach New Highs
Hass Index Reveals Kenya Coastal Land Price Trends Across 12 Towns
Among Mombasa suburbs, Bamburi recorded the strongest growth over the past five years, with land prices rising by 56.6 percent. Average land values stood at KSh57.9 million, while beachfront land averaged KSh97.4 million per acre.
Kikambala followed with a 42.1 percent increase, with land values averaging KSh26 million and beachfront acre prices at Ksh36.3 million.
In Kilifi Town, land prices rose by 40.1 percent over five years, with average land values reaching Ksh26.2 million and beachfront acre prices averaging Ksh47.1 million.
Also Read: List of Nairobi Estates and Satellite Towns Where Land Prices Have Dropped
Mombasa City posted a 38.3 percent rise, with average land values reaching KSh91.3 million and beachfront land averaging Ksh120.3 million per acre.
Shanzu recorded a 32 percent increase, with average land values at KSh63.7 million and beachfront land at Ksh98.6 million per acre.
Nyali saw a 24 percent rise, maintaining its position as the most expensive location, with average land prices at Ksh114 million and beachfront land averaging Ksh146.4 million per acre.
Both Vipingo and Mtwapa recorded a 24.7 percent increase each.
Vipingo’s average land prices stood at Ksh28.9 million with beachfront land at Ksh38.9 million per acre, while Mtwapa recorded Ksh37.9 million for average land and Ksh44.4 million per acre for beachfront plots.
Malindi recorded a more modest 22.9 percent growth over five years, with land averaging Ksh19 million and beachfront acres at Ksh25.9 million.
Hass Composite Land Index – Kenya Coastal Land Price Trends by Town
| Region | Town | Quarterly % Change | Annual % Change | 5-Year % Change | Average Value (Ksh) | Value Per Acre (Ksh) |
|---|---|---|---|---|---|---|
| North Coast | Lamu Island | 1.8% | 1.7% | 59.7% | 81,700,000 | 139,900,000 |
| Malindi | 1.5% | 2.1% | 22.9% | 19,000,000 | 25,900,000 | |
| Watamu | -0.5% | 4.3% | 70.4% | 35,000,000 | 44,500,000 | |
| Kilifi Town | 0.7% | 8.8% | 40.1% | 26,200,000 | 47,100,000 | |
| Mombasa Suburbs | Vipingo | 0.3% | 8.7% | 24.7% | 28,900,000 | 38,900,000 |
| Kikambala | 1.0% | 7.7% | 42.1% | 26,000,000 | 36,300,000 | |
| Mtwapa | -1.0% | 1.6% | 24.7% | 37,900,000 | 44,400,000 | |
| Shanzu | 1.3% | 5.2% | 32.0% | 63,700,000 | 98,600,000 | |
| Bamburi | -1.1% | 2.8% | 56.6% | 57,900,000 | 97,400,000 | |
| Nyali | 1.2% | 5.2% | 24.0% | 114,000,000 | 146,000,000 | |
| Mombasa City | Mombasa City | -1.0% | 1.3% | 38.3% | 91,300,000 | 120,300,000 |
| South Coast | Diani | 2.3% | 7.1% | 79.1% | 36,000,000 | 65,300,000 |