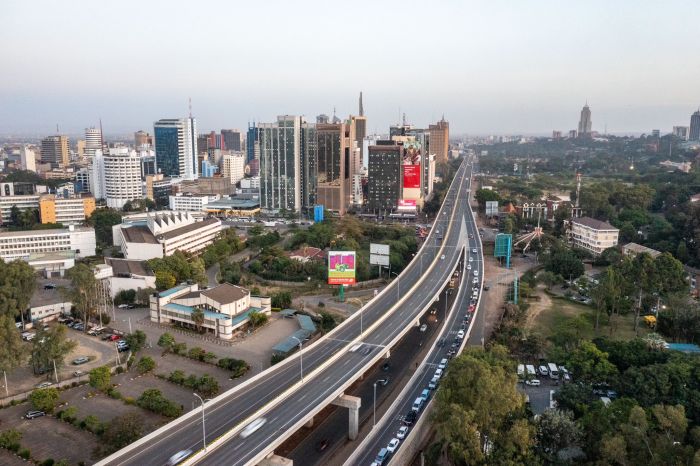
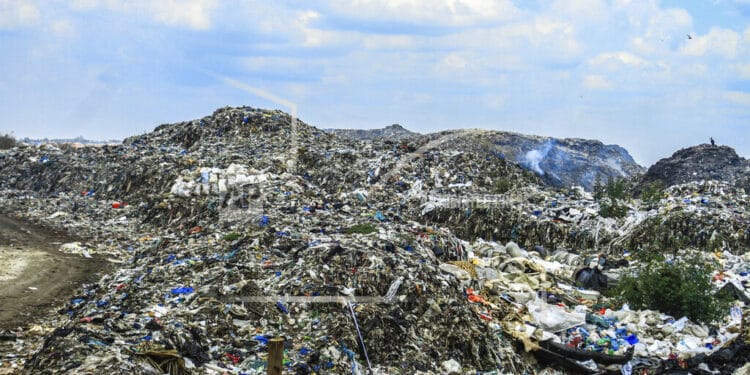
Nairobi City is the most-sought after city in Africa and ranks position 12 globally in terms of social life and economic sustainability, according to InterNations. Once upon a time it was known as the “green city in the sun”, but that was once upon a time. Today, as Ngugi wa Thiong’o prophesied in Petals of Blood, Nairobi is cold, corrupt, heartless, polluted, congested and unforgiving (the emphasis is mine).
Kenya nation-state is many things, depending on what you are looking for. What is however incontrovertible is its failure to treat its citizens with soft gloves. I visited Dandora dumpsite this week. The place is horrible than the tea we took in high school. If you want to see the true picture of Nairobi, instead of mounting your viewfinder at All Saint’s Cathedral, just visit Dandora dumpsite. There, the hidden color of Nairobi is visible in HD: filthy, predatory and deeply unforgiving.
The new administration claims the previous regime is responsible for the mess. The governor, Johnson Sakaja, says he plans to designate new garbage collection points in all the 17 sub-counties as one way of addressing illegal dumping.
“I already met sub-county administrators and officials from the environment department, we are going to publish the designated collection points for the public to know where they will be dumping,” he recently said.
He sounds and looks like he has an idea that can work, at least in the head. “So far we have collected 76,000 tonnes since we came in. Once the areas are identified, we will expect everyone to ensure we have a clean city,” he confirms.
Bizarrely, so far, Dandora is the only legal dumpsite in Nairobi. It was declared full in 2001. Put differently, Mwai Kibaki had not ended Moi’s not-so-stellar 24-year reign, and Wangari Maathai had not won the Nobel Peace Prize; what is still Nairobi’s only “legal” dumpsite was already full.
The failure of the Kenyan state to promote the kind of social life in which every Kenyan lives with dignity is evident in the sad fact that there are families that depend on this dumpsite for food.
Waste Management
Before 1980, recycling and incineration of plastic was insignificant; 100 percent was therefore discarded. From 1980, as the good folks at Our World in Data have captured, for incineration, and 1990 for recycling, rates increased on average by about 0.7 percent per year. In 2015, for instance, an estimated 55 percent of global plastic waste was discarded, 25 percent was incinerated, and 20 percent recycled.
It is estimated that by 2050, incineration rates would increase to 50 percent; recycling to 44 percent; and discarded waste would fall to 6 percent ds and does not represent concrete projections.
What is the per capita rate of plastic waste generation, measured in kilograms per person per day? Daily per capita plastic waste across the highest countries – Kuwait, Guyana, Germany, Netherlands, Ireland, the United States – is more than ten times higher than across many countries such as India, Tanzania, Mozambique and Bangladesh.
These figures represent total plastic waste generation and do not account for differences in waste management, recycling or incineration. They therefore do not represent quantities of plastic at risk of loss to the ocean or other waterways. As of 2017, Kenya had a daily per capita plastic waste of 0.03kg per person per day.
Instructively, as experts have noted, plastic will only enter rivers and the ocean if it’s poorly managed. In rich countries, nearly all of its plastic waste is incinerated, recycled, or sent to well-managed landfills. It’s not left open to the surrounding environment. Low-to-middle income countries, particularly in the Global South, tend to have poorer waste management infrastructure. Waste can be dumped outside of landfills, and landfills that do exist are often open, leaking waste to the surrounding environment. Poorly managed waste in low-to-middle income countries is therefore much higher.
Mismanaged waste is defined as is material which is at high risk of entering the ocean via wind or tidal transport, or carried to coastlines from inland waterways. It is the sum of material which is either littered or inadequately disposed.
As Our World in Data argues, there is often intense debate about the relative importance of marine and land sources for ocean pollution. At the global level, they observe, best estimates suggest that approximately 80 percent of ocean plastics come from land-based sources, and the remaining 20 percent from marine sources.
“Of the 20 percent from marine sources, it’s estimated that around half (10 percentage points) arises from fishing fleets (such as nets, lines and abandoned vessels). This is supported by figures from the United Nations Environment Programme (UNEP) which suggests abandoned, lost or discarded fishing gear contributes approximately 10 percent to total ocean plastics,” they note.
Although uncertain, it’s likely that marine sources contribute between 20 per cent and 30 per cent of ocean plastics, but the dominant source remains land-based input at 70 per cent to 80 per cent.
Our World in Data goes ahead to note that: Whilst this is the relative contribution as an aggregate of global ocean plastics, the relative contribution of different sources will vary depending on geographical location and context. For example, our most recent estimates of the contribution of marine sources to the ‘Great Pacific Garbage Patch’ (GPGP) is that abandoned, lost or otherwise discarded fishing gear make up 75 per cent of 86 per cent of floating plastic mass (greater than 5 centimeters). This research suggests that most of this fishing activity originates from five countries – Japan, South Korea, China, the United States and Taiwan.
That said, to tackle plastic pollution, as exerts argue, it’s important to know what rivers these plastics are coming from. It also helps if we understand why these rivers emit so much. Most of the world’s largest emitting rivers are in Asia, with some also in East Africa and the Caribbean.
Also Read: How World Income Impacts Global Expenditure on Healthcare
“Seven of the top ten rivers are in the Philippines. Two are in India, and one in Malaysia. The Pasig River in the Philippines alone accounts for 6.4 per cent of global river plastics. This paints a very different picture to earlier studies where it was Asia’s largest rivers – the Yangtze, Xi, and Huangpu rivers in China, and Ganges in India – that were dominant,” Our World in Data observes.
As it has been observed, plastic pollution is dominant where the local waste management practices are poor. This means there is a large amount of mismanaged plastic waste that can enter rivers and the ocean in the first place. This makes clear that improving waste management is essential if we’re to tackle plastic pollution. Second, the largest emitters tend to have cities nearby: this means there are a lot of paved surfaces where both water and plastic can drain into river outlets. Cities such as Jakarta in Indonesia and Manila in the Philippines are drained by relatively small rivers but account for a large share of plastic emissions. Third, the river basins had high precipitation rates (meaning plastics washed into rivers, and the flow rate of rivers to the ocean was high). Fourth, distance matters: the largest emitting rivers had cities nearby and were also very close to the coast.
One study illustrates the importance of the additional climate, basin terrain, and proximity factors with a real-life example. The Ciliwung River basin in Java is 275 times smaller than the Rhine river basin in Europe and generates 75 per cent less plastic waste. Yet it emits 100 times as much plastic to the ocean each year (200 to 300 tonnes versus only 3 to 5 tonnes). The Ciliwung River emits much more plastic to the ocean, despite being much smaller because the basin’s waste is generated very close to the river (meaning the plastic gets into the river network in the first place) and the river network is also much closer to the ocean. It also gets much more rainfall meaning the plastic waste is more easily transported than in the Rhine basin.
Unequal Society
The primary role of any government is to help its people achieve their aspirations. And no Kenyan, or Ugandan or Nigerian, for that matter, aspires to eat from a dumpsite. Before we look at what this heartbreaking situation tells us about the Kenyan state, there are a few things about Dandora dumpsite that we need to know.
Dandora dumpsite was started in the 1970s. It receives between 1,500 to 2,000 tons of organic and inorganic waste daily and uses open dumping method. Contrary to what Occupational Safety and Health Act of 2007 says, staff at the dumpsite lack modern protective clothing, unsurprisingly.
According to Nairobi City County government sectoral committee on environment and natural resources, the weighbridge installed at the dumpsite in 2010 has not been operational since August 2018. It means the County government is unable to measure waste deposited by the contractors. And the power plant at the dumpsite that is worth at least Ksh 28 billion is unfunctional.
So, what does the image of Kenyans combing a dumpsite for food tell us about the Kenyan state? We are a deeply unequal caste-like society. On one side we have the vulgar opportunist bourgeoisie – entitled and rapacious – and on the other an impoverished proletariat that uses silence as a language and loyalty to ethnic nationalism as a sacred honor. Of course the political leadership has a hand in it.
The inequality extends to all aspects of life. “Not all of us are equal before the law” is as real in Kenya as it is in any society. As they say, laws are made for the poor. For instance, while the poor went to jail for allegedly violating Covid-19 guidelines, that is if they were lucky to escape bullets, the rich cruised the night past curfew hours with impunity.
The heartbreaking sight of Kenyans eating from a dumpsite is the clearest mirror of the socio-economic inequality in this country. Kenya is faced with a “class problem” basically because its bourgeoisie have revolutionalised the instruments of production, as is the case in all capitalist dispensations.
The relations of production favor the rich, so does the society and its rules. As Marx and Engels brilliantly observed in The Communist Manifesto, “the history of all existing societies is a history of class struggle”.
The whole texture and life of a country takes a disturbing route when the everyday citizen’s dignity is consumed by the mechanics of bureaucratic greed. A country that cannot manage its waste cannot manage its future.
Also Read: How the World Became Less Democratic
Somehow Kenyan state has not noticed that the masses have noticed that the former is unable to notice their dissatisfaction and pent-up anger. This explains why Kenyans ought to challenge the status-quo.
The social contract between Kenyans and their government is a failed one. Those who wield the means of production, the colonialist bourgeoisie, have successfully managed to drive into the masses’ mind the idea of a society where wealth lies in thought and tribe is a constant in the pursuit of power.
In ancient Rome, the dominant elite used to throw crumbs of bread to the masses to keep them quiet. The dominant elite do the same thing in Kenya, albeit in a different way. They promote policies that are designed to widen the gap between the rich and the poor while serving as a panacea. Kenyan dominant elite is a product of entrenched economic inequality that J.M Kariuki protested against in 1975. Every human being deserves to live a decent life. And Kenyans are human beings too.


